Almost every rotation backtest we come across is presented gross of costs, or with costs pushed into a footnote. The reason is easy to guess: at a few basis points per trade the adjustment looks marginal, and nobody likes taking points off an attractive equity curve. Our approach is different: in a strategy that changes its holdings every month, transaction costs are part of the result, not something to deal with after the fact.
To put a number on it, we took the strategy we use — a model portfolio of four US-listed ETFs, reviewed roughly once a month, that moves entirely to cash when conditions turn adverse — and ran the same backtest five times, changing a single input: the cost per side of each trade. Same signals, same holdings, same dates, from September 28, 2007 to September 18, 2026. Two assumptions apply to every run: idle cash earns the 3-month US rate, and ETF dividends are excluded (which penalizes the strategy rather than helping it). These are backtested results, not live results.
Results
| Cost per side | CAGR | Sharpe | Max drawdown | $100,000 becomes |
|---|---|---|---|---|
| 0 bps | 14.5% | 0.88 | −28.5% | $1,302,000 |
| 5 bps · our base case | 13.8% | 0.85 | −28.6% | $1,158,000 |
| 10 bps | 13.1% | 0.81 | −28.6% | $1,029,000 |
| 20 bps | 11.7% | 0.74 | −30.7% | $812,000 |
| 30 bps | 10.3% | 0.66 | −32.9% | $641,000 |
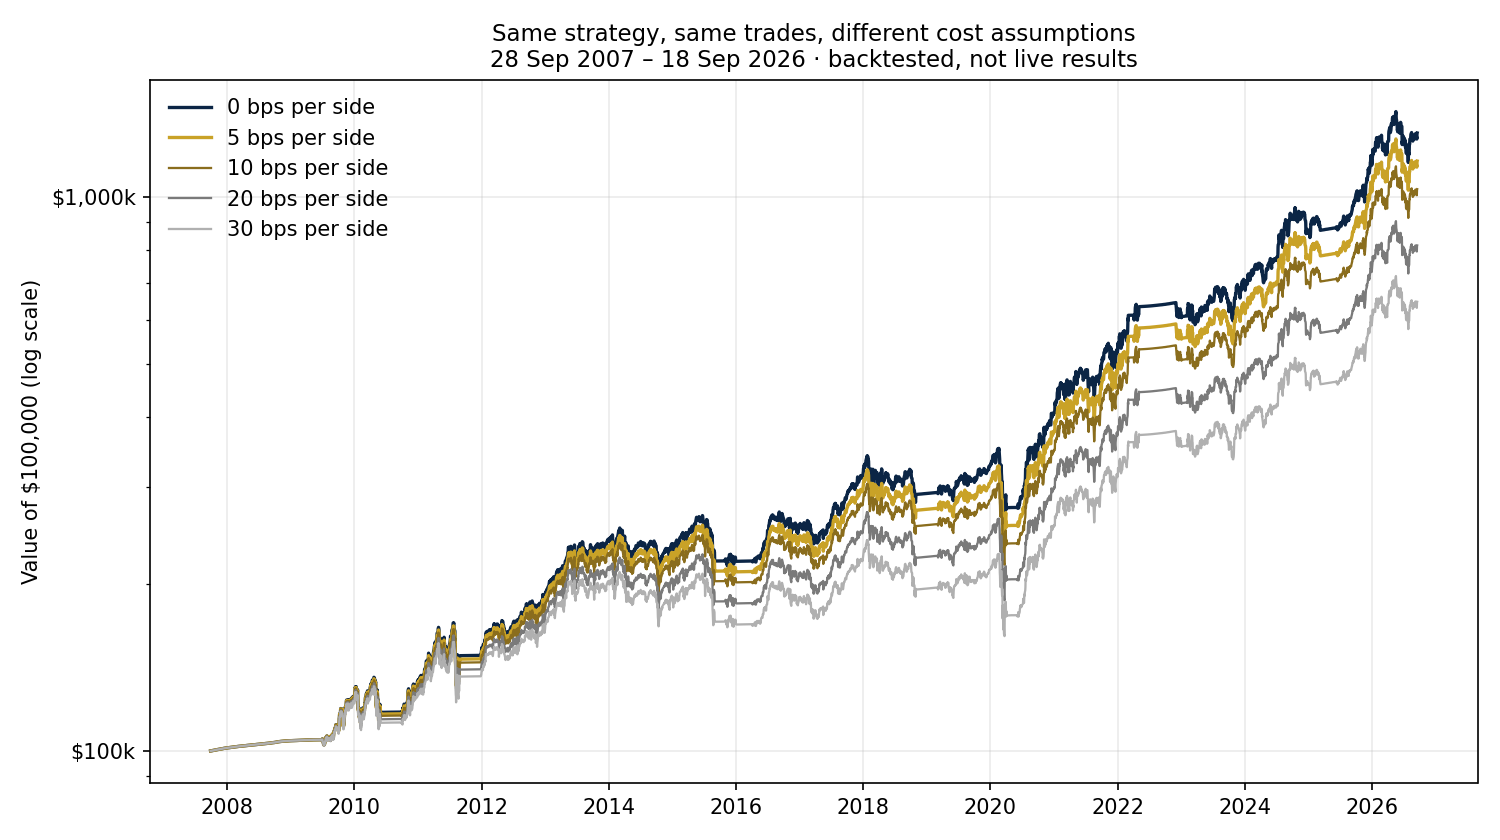
The row most readers skip is the second one. Going from zero to 5 bps per side costs about 0.7 percentage points a year: on paper, noise. Compounded over 19 years, though, it becomes a $144,000 difference on $100,000 of starting capital — more than the entire initial investment. At 30 bps, final capital is $641,000 instead of $1.302 million: roughly half, with nothing changed except the price paid to execute exactly the same trades.
The mechanics are simple, if not always intuitive: over the whole period the model went through 228 reviews and 934 individual trades, about 49 a year, for an annual turnover of around 11.7 times capital. None of those trades is expensive on its own: it is repetition, combined with compounding, that makes the difference large. And the gap hides where most investors look for risk. Maximum drawdown barely moves between 0 and 10 bps (−28.5% against −28.6%), while final capital drops by about a fifth: costs can weigh heavily on final wealth even when the worst decline hardly changes.
"Commissions are zero now"
A reasonable objection is that commissions are close to zero today, so the whole exercise is academic. It isn't: the commission is only one part of the cost. The bid-ask spread, and the gap between the price the model assumes and the price actually obtained, are still there and show up on no statement. On the most liquid ETFs, 5 bps per side is the assumption we use as our base case, but on less liquid products, in thin sessions or with less competitive brokers, the real cost can be considerably higher.
In more than 21 years behind the screens we have seen it all: spreads widening to over 100 basis points during the most turbulent phases of the market (the subprime crisis will stay etched in memory forever, and more recently the Covid-19 pandemic brought days we would not hesitate to call “psychedelic”), and extremely thin liquidity even in quieter periods, especially in the sessions around long holiday weekends. That is why we show the whole range from 0 to 30 bps instead of a single number presented as if it applied to everyone: investors know their own execution better than any backtest does.
Three questions before trusting a backtest
So what should an investor ask before trusting a rotation backtest? Three things, in our view: whether results are gross or net, what cost per side was assumed, and how often the portfolio changes. The third is the one almost nobody asks, and it multiplies the other two: the same 10 bps weigh very differently on a strategy that trades twice a year and on one that trades fifty times.
None of this is an argument against systematic rotation. Even at 30 bps per side, this strategy still compounds at 10.3% a year with a Sharpe ratio of 0.66: costs make it worse, they don't break it. But in this case the difference between 14.5% and 10.3% comes down to execution, and a number that depends on execution should be measured, not underestimated or, worse, ignored.
Backtested results are hypothetical and do not represent actual trading results. No orders were placed and no fills occurred. Past performance is not indicative of future results. This article is general information, not personalised investment advice.